
Food
Do Ultra-Processed Foods Shorten Your Life?
Long studies link heavy ultra-processed food intake to earlier death, and an NIH trial found it drives overeating. No trial has tested lifespan.

“Ultra-processed” started life as a research category built by Brazilian nutrition scientists. Now it’s a podcast staple and a grocery-aisle argument. That’s quite a career for a technical term. Humanic Blue is asking whether ultra-processed foods shorten your life, and the research gives a layered answer.
No study has shown directly that they do. In long observational studies of hundreds of thousands of people, those who eat the most ultra-processed food are somewhat more likely to die during follow-up. That’s a link, not proof. A small National Institutes of Health trial did show cause and effect over a short stretch: people ate about 500 more calories a day on an ultra-processed diet. No trial has tested whether eating less of it helps people live longer, and the label covers everything from soda to packaged whole-grain bread.
In This Article
Key Takeaways
- In long observational studies, people who eat the most ultra-processed food are more likely to die during follow-up, though in some very large studies the difference is small. These are observational findings, not proof of cause and effect.
- In a controlled NIH trial, an ultra-processed diet made people eat more and gain weight over two weeks. This establishes a short-term effect of the tested menu, not a lifespan effect.
- No trial has tested whether cutting ultra-processed food helps people live longer.
- The category is broad. In Harvard studies, processed meats and sweetened drinks carried stronger links to death, while whole-grain breads and cereals were linked to lower diabetes risk. These studies observed eating habits; they did not test food swaps.
- Researchers still disagree about whether processing itself causes harm or mostly signals a poorer diet overall.
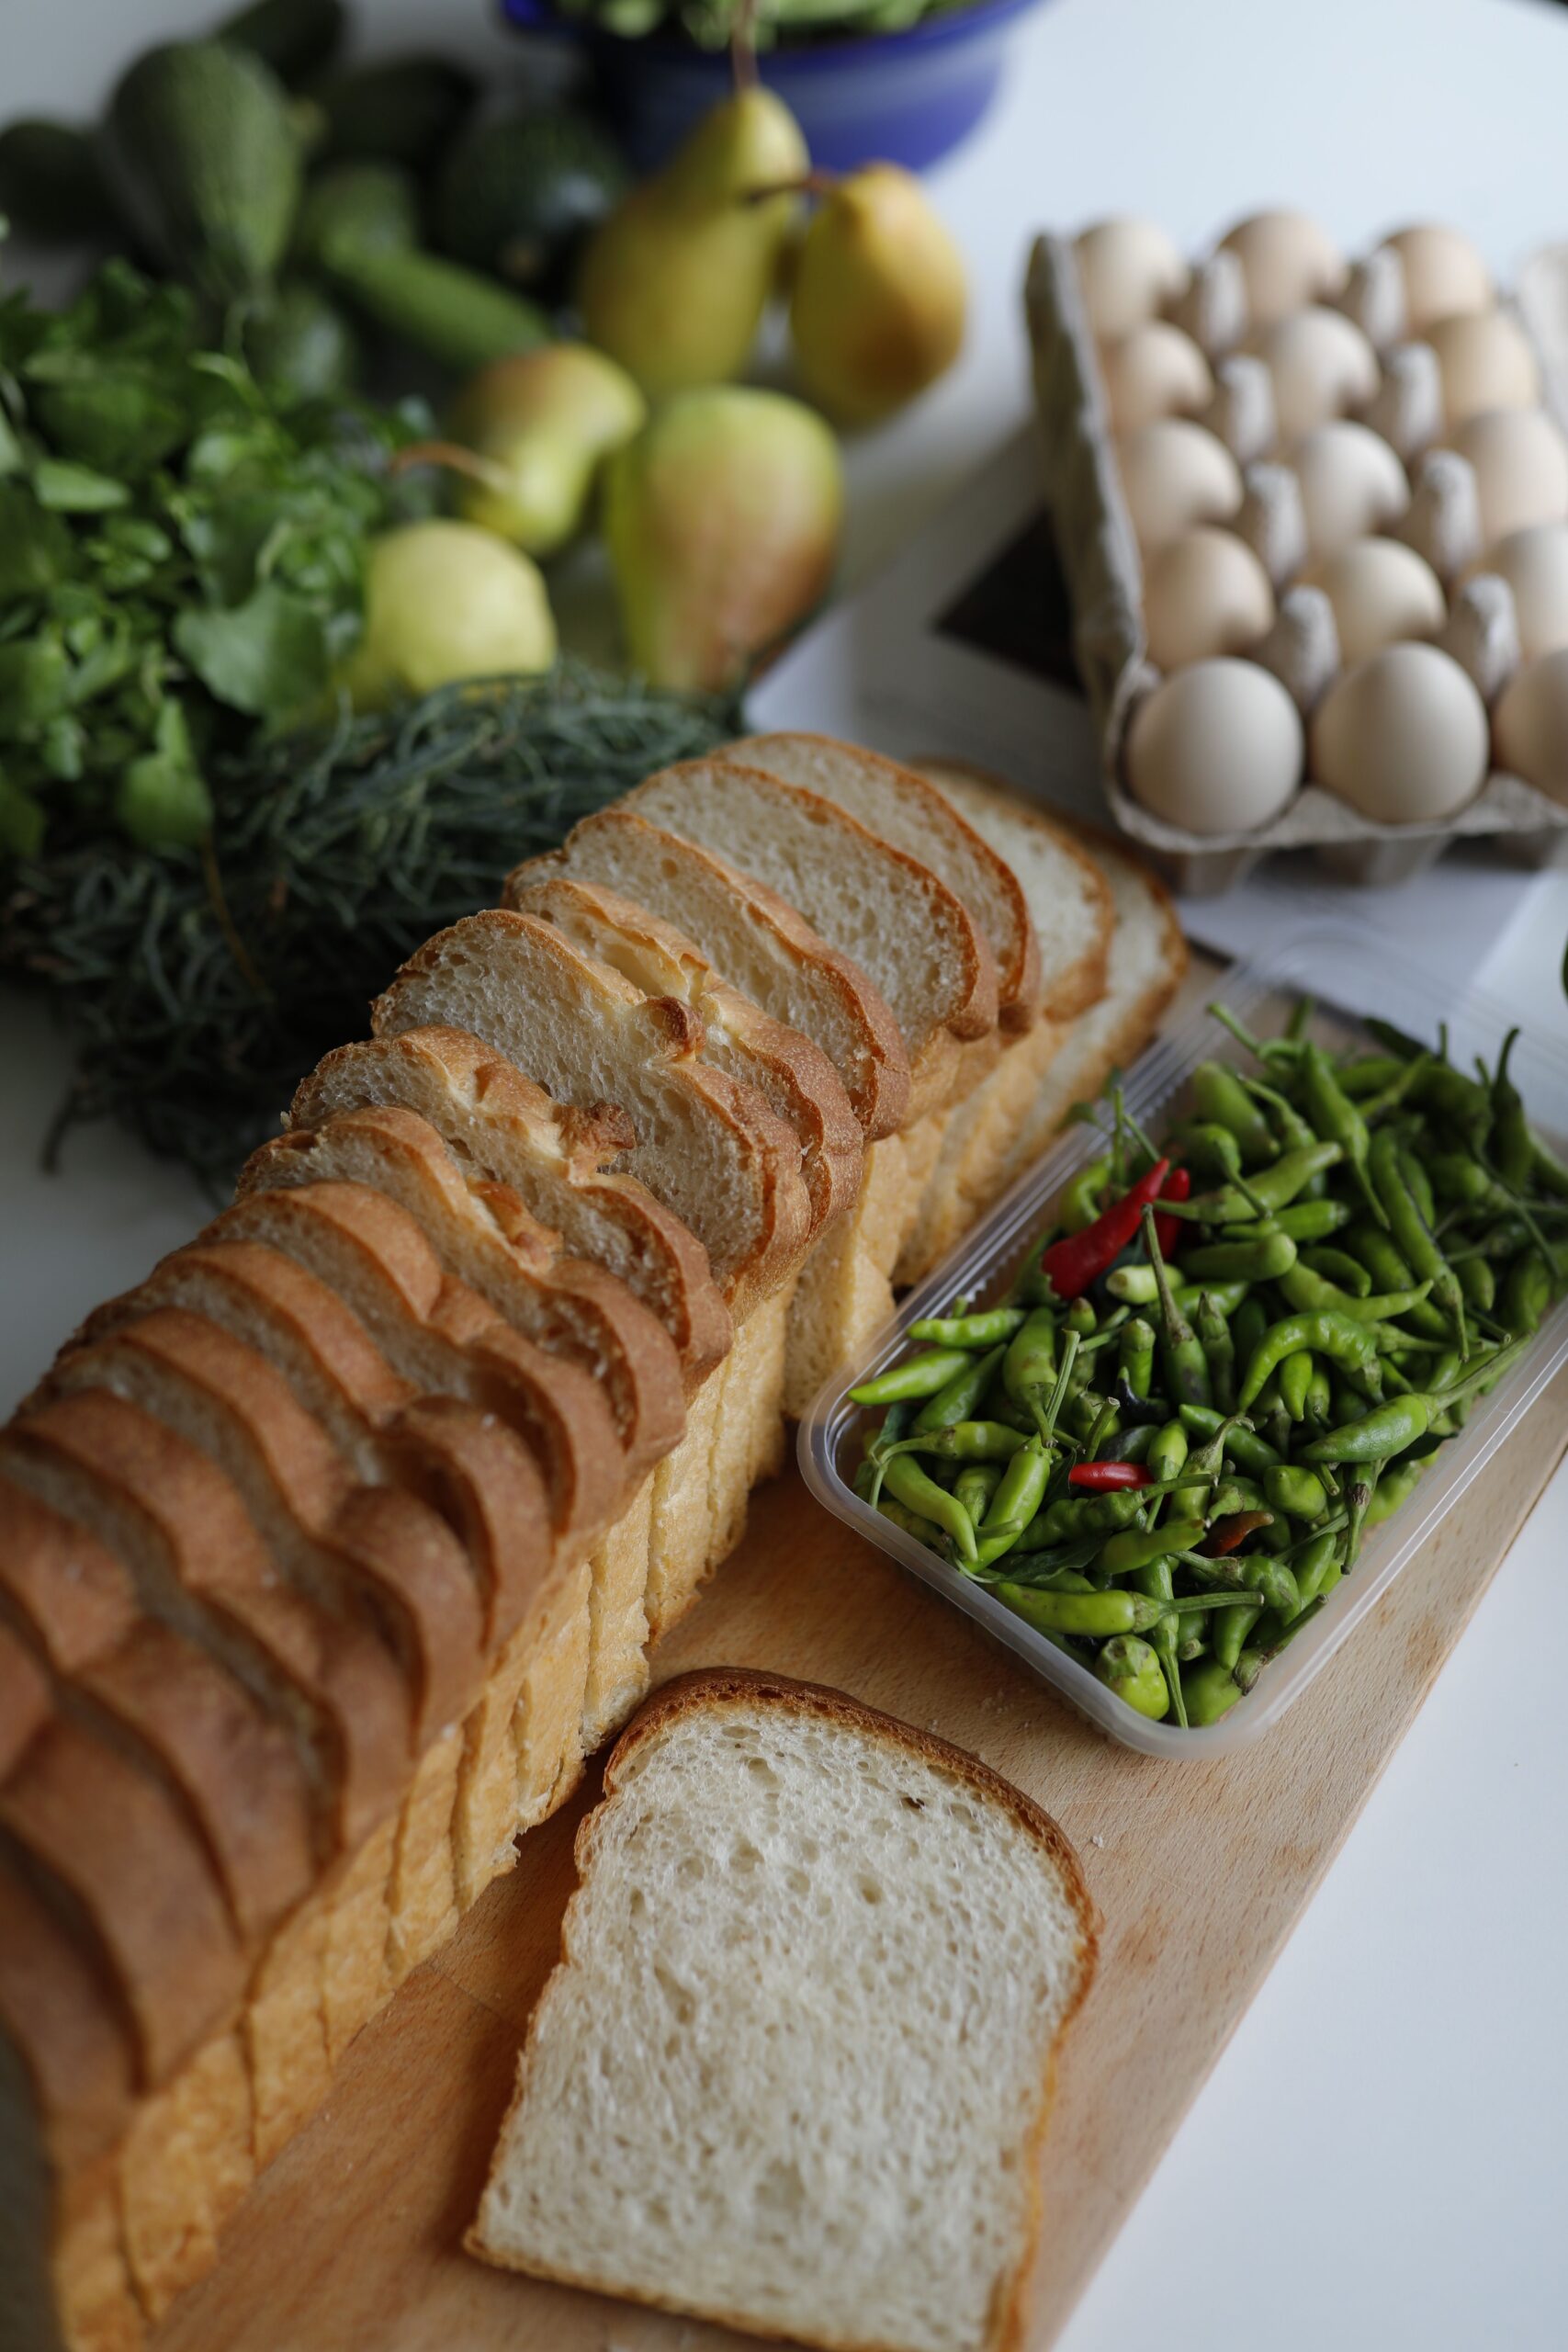
Where does NOVA draw the line?
Every study in this article defines ultra-processed food with NOVA, a four-group system from Carlos Monteiro and colleagues at the University of São Paulo. Group 1 is unprocessed or minimally processed food: fresh produce, eggs, milk, and foods that are frozen, pasteurized or dried. Group 2 is kitchen ingredients such as oils, butter, sugar and salt. Group 3 is processed food such as canned fish, bottled vegetables, cheeses and freshly made bread.
Group 4, the ultra-processed group, is different in kind. Monteiro’s team describes these products as “formulations made mostly or entirely from substances derived from foods and additives, with little if any intact Group 1 food.” Think soft drinks, packaged snacks, reconstituted meats, mass-produced packaged bread and many ready-to-heat meals, often made with flavors, colors, emulsifiers or protein isolates you wouldn’t keep at home. (Note 1)
So “processed” and “ultra-processed” aren’t the same thing. Freezing vegetables, pasteurizing milk and canning beans are all processing. NOVA is aiming at a different, industrial pattern.
The line is useful but blurry. When French nutrition researchers asked more than 150 food and nutrition specialists to sort foods into NOVA groups, agreement was low, even when ingredient lists were provided. That study got a small amount of funding from a French food-and-health fund partly sponsored by the food industry. (Note 2) How the sorting study worked
What did the feeding trials show?
The two controlled trials found greater food intake or less weight loss on ultra-processed diets over weeks; neither measured lifespan.
In 2019, Kevin Hall, then a senior investigator at the NIH’s National Institute of Diabetes and Digestive and Kidney Diseases, led what the NIH called the first randomized controlled trial of ultra-processed foods as NOVA defines them. His team admitted a small group of adults to the NIH Clinical Center for four weeks. Each spent two weeks on an ultra-processed diet and two on an unprocessed one, in random order.
Breakfast might be a bagel with cream cheese and turkey bacon, or oatmeal with bananas, walnuts and skim milk. The menus offered matching calories, sugar, sodium, fiber and macronutrients—the main nutrients supplying energy, including protein, fat and carbohydrate— and people could eat as much or as little as they liked.
On the ultra-processed menu, people ate about 500 more calories a day, ate faster and gained about 0.9 kilograms (2 pounds). On the unprocessed menu, they lost about the same amount. “This is the first study to demonstrate causality — that ultra-processed foods cause people to eat too many calories and gain weight,” Hall said in the NIH’s announcement. (Note 3)
That causality covers intake and weight over two weeks. A small trial lasting a month can’t measure heart attacks, cancer or lifespan, and the trial wasn’t built to show which feature of the food drove the difference. Hall retired from the NIH in 2025, citing censorship of his research, which HHS denied.
A second trial, published in 2025 by a University College London team led by Samuel Dicken, tested a harder question. It gave adults with overweight or obesity eight weeks of each diet, both built to follow the UK’s official healthy-eating guide. People lost weight on both, but lost about twice as much on the minimally processed version: roughly 2% of body weight against 1%. Most participants were women. The trial’s senior author has been an employee of Eli Lilly, which makes weight-loss drugs, since 2023. (Note 4) The trial details
What do the feeding trials establish that the long-term mortality studies cannot?
Do long studies link heavy intake to earlier death?
Death is where observational studies take over. A 2025 pooled analysis from researchers at Beijing Friendship Hospital combined 18 cohort studies covering more than a million people. Those eating the most ultra-processed food were about 15% more likely to die during follow-up than those eating the least. The results varied a lot from study to study. (Note 5)
The European EPIC study, run by the World Health Organization’s International Agency for Research on Cancer, followed about 429,000 adults in nine European countries for an average of about 16 years. Higher ultra-processed intake was linked to more deaths from heart and circulatory disease, digestive disease and Parkinson’s disease. It wasn’t linked to deaths from cancer or Alzheimer’s disease. (Note 6)
A Harvard T.H. Chan School of Public Health team led by Mingyang Song followed about 114,000 US nurses and health professionals for more than 30 years. The heaviest ultra-processed eaters had about 4% higher death rates, with no link to cancer or heart-disease deaths. Among people with similar overall diet quality, the researchers found no consistent link at all. They wrote that “Dietary quality was observed to have a more predominant influence on mortality outcomes than ultra-processed food consumption.” (Note 7)
Two reviews of these reviews reach similar conclusions with different confidence. A 2024 BMJ review combining earlier research reviews from Deakin University found links with 32 health outcomes across almost 9.9 million people, but rated the evidence for dying early as low certainty. The Deakin centre has received research funding from food companies. A 2025 review from the German Diabetes Center rated the all-cause death evidence as moderate certainty. (Note 8, Note 9) See the mortality numbers
All of this is association. People who eat more ultra-processed food also differ in smoking, income, activity and the rest of their diets, and statistics can’t fully separate those threads.
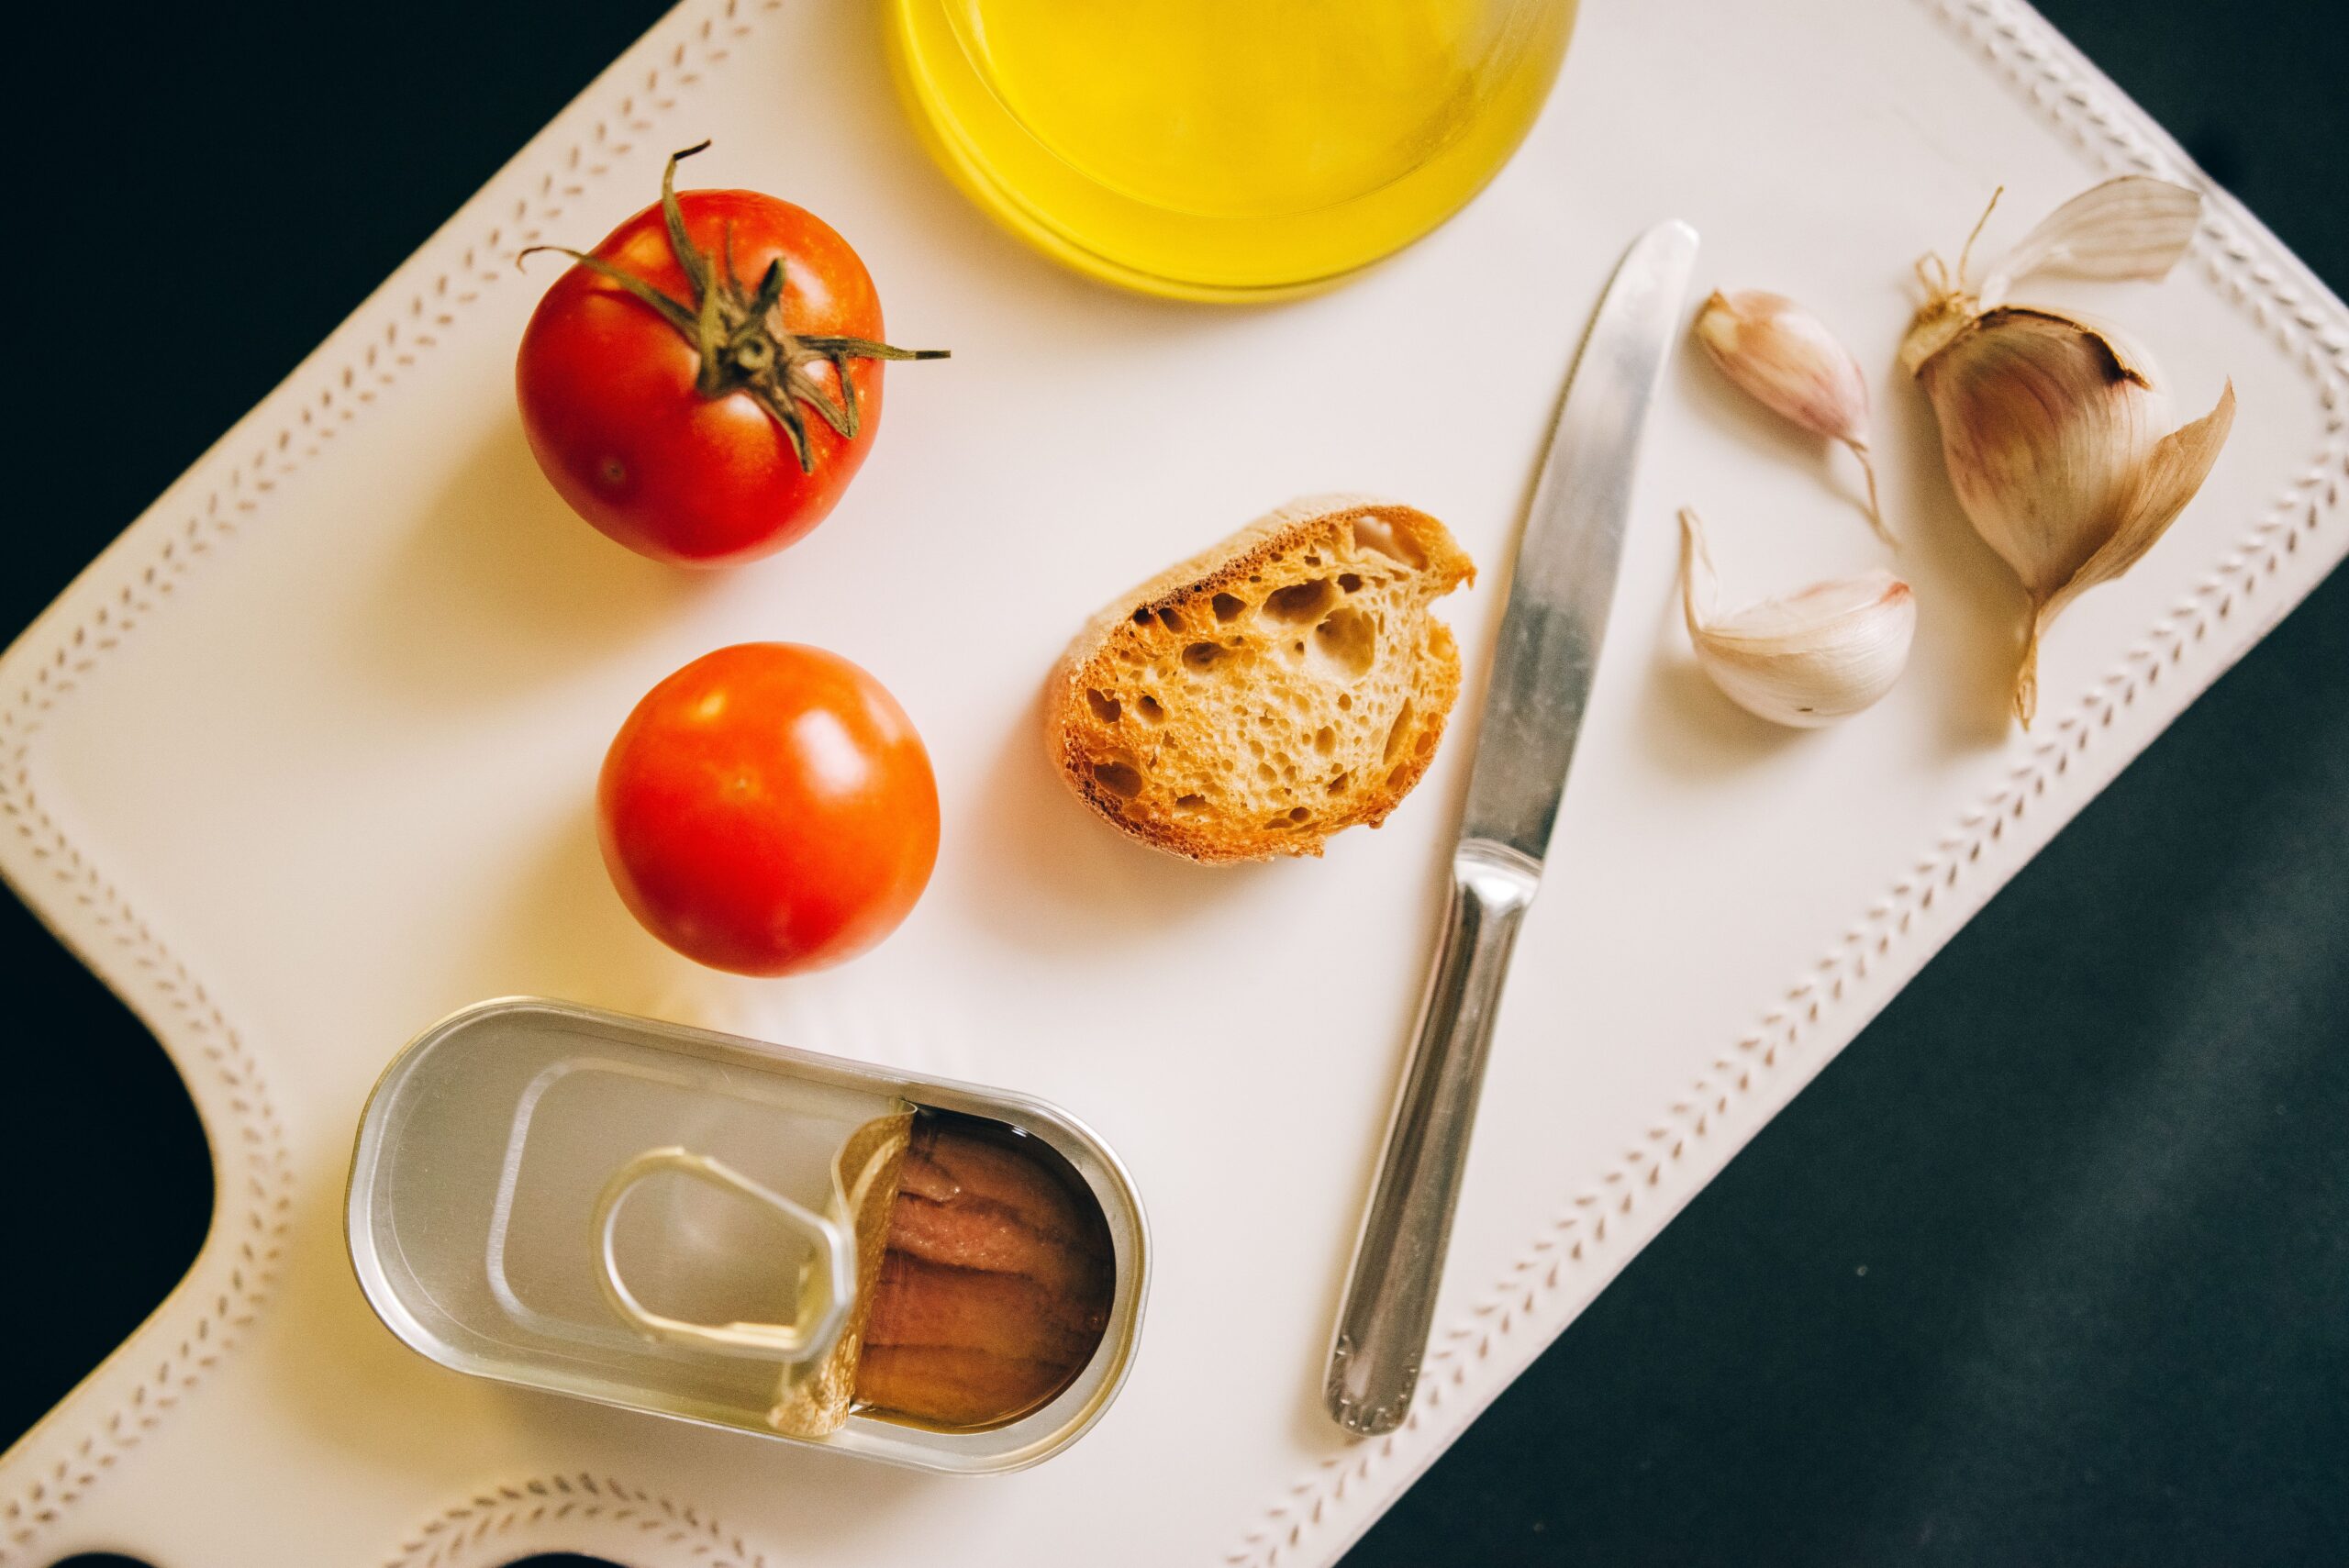
Soda and whole-grain bread share a label, but findings differ
Inside the category, foods don’t behave alike. In the Harvard mortality study, ready-to-eat meat, poultry and seafood products, such as processed meat, had the most consistent links with death. Sugar-sweetened and artificially sweetened drinks, dairy-based desserts and ultra-processed breakfast foods also carried higher risk.
The same Harvard group, in a 2023 study of type 2 diabetes, found some ultra-processed subgroups linked to lower risk: cereals, dark and whole-grain breads, yogurt and dairy desserts among them. That was diabetes, not death, but it shows why the Harvard team deliberately left whole grains out of its mortality analysis. The authors said they aimed “to rectify the potential misperception that all ultra-processed food products should be universally restricted.” (Note 10)
Janett Barbaresko and colleagues at the German Diabetes Center framed the open question directly. In their review, they wrote that it is still unclear whether processing itself raises health risks, or whether eating a lot of ultra-processed food is mainly a marker of poor diet quality. The subgroup details
How would food-by-food differences affect a claim about the entire NOVA category?
What do WHO and US dietary guidance say?
The World Health Organization began recruiting experts for a guideline on ultra-processed food in May 2025, saying a “growing body of evidence suggests” these diets are linked to higher risk of diet-related disease. As of September 25, 2026, WHO’s guideline page still describes its expert group as provisional, and no final WHO recommendation has been published.
In the US, the 2025–2030 Dietary Guidelines for Americans, released in January 2026, tell people to “Avoid highly processed packaged, prepared, ready-to-eat, or other foods that are salty or sweet, such as chips, cookies, and candy that have added sugars and sodium (salt).” The guidelines use “highly processed” rather than NOVA’s exact definition.
The same guidelines also say that “Frozen, dried, or canned vegetables or fruits with no or very limited added sugars can also be good options.” Convenience and nutrition aren’t opposites, even in the government’s own telling.
What’s Interesting
The NIH trial’s most striking detail isn’t an ingredient. It’s that people ate more from one menu even though the two menus were matched on the nutrients most labels track. The UK trial added a twist: an ultra-processed diet built to official guidelines still produced weight loss. Just about half as much.
The NIH’s own announcement flagged one candidate explanation: it noted that slight differences in protein between the two menus “could potentially explain as much as half the difference in calorie intake.” That shifts the question from “Which ingredient is bad?” to “What about a food makes people eat more of it, and faster?” It’s a less satisfying argument online. It’s a more useful one for designing the next trial.
What This Means in Practice
For living longer and better, the research points at overall patterns rather than individual labels. The Harvard team’s finding that diet quality mattered more than processing is a reminder that these results come from averages across very large groups, and individual diets, budgets and health needs differ.
- The Harvard finding varied by food group. Processed meats and sweetened drinks carried consistent mortality associations, and the US guidelines say: “Avoid sugar-sweetened beverages, such as sodas, fruit drinks, and energy drinks.”
- Frozen and canned produce count. The US guidelines list them as good options when there’s little or no added sugar.
- Mind the trade-off. For an older adult with a small appetite, a fortified convenience food may be supplying calories and protein. A registered dietitian can check what any swap would replace.
- Cost and time are real constraints. “We have to be mindful that it takes more time and more money to prepare less-processed foods,” Hall said in the NIH’s announcement.
A registered dietitian can help identify the handful of products doing most of the work in a person’s diet and find replacements that keep protein, fiber, affordability and pleasure. A primary care doctor can connect diet changes to weight, blood sugar and blood pressure goals.
A whole-diet comparison appears in Mediterranean Diet for Longevity, which reviews outcomes without treating one label as a guarantee.
Bottom Line
People who eat the most ultra-processed food are somewhat more likely to die during long studies, though the links are modest in some large cohorts and weaken when overall diet quality is considered. One NIH trial showed a direct short-term effect on overeating and weight. Nobody has tested whether eating less ultra-processed food helps people live longer, and the category mixes processed meat with whole-grain bread. What remains open is whether processing itself is the problem or a marker of a poorer diet. Current US guidelines already advise cutting highly processed, salty and sweet foods, and a dietitian can help sort out which ones matter most in a given diet.
A NOTE FROM LONGEVITY365
We read research, consult expert perspectives and work to make complicated health information easier to understand. What you’re reading here reflects how we’ve interpreted and organized that information. It is educational content—not personal medical advice, diagnosis or treatment guidance.
We’re not perfect, and neither is the available research. Evidence changes, new studies emerge and what’s appropriate for one person may not be appropriate for another.
Use this article as a starting point for your own research and conversations with qualified professionals. Always talk with your doctor or another trusted healthcare professional before making decisions that could affect your health, particularly if you take medications, are receiving treatment, have existing health conditions, are pregnant or have other circumstances that could affect what’s appropriate for you.
Reader Questions
A few questions to carry into the comments or your next conversation. Please leave out identifying or personal medical details.
- 01Which part of this food question feels most practical in real life: what to eat, how much, timing, cost, or consistency?
- 02Where do you still see a gap between population evidence and the way one person actually eats?
- 03What would make "Do Ultra-Processed Foods Shorten Your Life" easier to discuss without turning food into another thing to optimize perfectly?
Extra Insights & Sources
For readers who want the details behind each claim above.
What We Know
- In a small inpatient randomized crossover trial, the tested ultra-processed diet caused higher energy intake and short-term weight gain. Established for the experimental diets and two-week periods.
- Higher intake is consistently associated with all-cause mortality, cardiovascular disease, type 2 diabetes and several other outcomes. Supported (observational association).
- NOVA captures an aspect of food production that nutrient-only measures can miss. Supported. It also groups very different foods together, and trained specialists often disagree on how to classify them.
What We Don’t Know
- How much of the long-term association is caused by processing rather than calories, nutrient profile, food texture, socioeconomic conditions or displacement of minimally processed foods. Contested/Unknown.
- Which industrial features drive overeating and disease risk. Eating rate, texture, energy density experienced during eating, protein leverage (the hypothesis that people eat more total food to maintain protein intake when protein supplies a smaller share of calories), palatability, additives and food structure are all under study and can’t yet be ranked with confidence. Unknown.
- Whether reducing ultra-processed-food intake independently extends human lifespan. Unknown. No long-term randomized mortality trial has answered it.
Three rungs of evidence
| Evidence rung | What it shows | What it leaves unresolved |
|---|---|---|
| Controlled feeding trials | The NIH ultra-processed menu caused higher intake and weight gain over two weeks; in the UK trial, both diets led to weight loss but the minimally processed one produced more | Which feature caused it; whether every Group 4 food behaves alike; long-term disease outcomes |
| Prospective cohorts | People with higher intake experience more disease and earlier death over years | Residual confounding, diet-measurement error, and illness changing diet rather than the other way around |
| Human lifespan trial | Would directly test whether reducing ultra-processed food prevents death | No such long-term randomized trial exists |
The feeding trials show a plausible pathway through overeating and weight gain, which the observational studies alone can’t. They fall well short of showing that reducing the whole category makes people live longer.
The NOVA groups and the classification debate
NOVA definitions. In Public Health Nutrition (2018, first published online 2017), Carlos Augusto Monteiro and colleagues at the University of São Paulo describe NOVA as grouping foods “according to the nature, extent and purpose of the industrial processing they undergo.” Minimally processed foods include those altered by drying, pasteurization, chilling, freezing and similar processes. Processed foods, “such as bottled vegetables, canned fish, fruits in syrup, cheeses and freshly made breads,” are made by adding Group 2 ingredients to Group 1 foods. Ultra-processed ingredients include “hydrogenated or interesterified oils, hydrolysed proteins, soya protein isolate, maltodextrin, invert sugar and high-fructose corn syrup,” and additives found only in ultra-processed products include colours, flavours, flavour enhancers, non-sugar sweeteners and emulsifiers. Group 4 examples include “mass-produced packaged breads.”
Classification agreement. Véronique Braesco and colleagues (European Journal of Clinical Nutrition, 2022) asked French food and nutrition specialists to assign 120 marketed products (with ingredient lists; 159 evaluators) and 111 generic foods (without ingredient lists; 177 evaluators) to NOVA groups. Agreement, measured by Fleiss’ kappa, was 0.32 and 0.34 respectively. Kappa measures agreement after allowing for agreement expected by chance: 1 means perfect agreement and 0 means chance-level agreement. These values are not percentages of evaluators agreeing. The authors concluded that “overall consistency among evaluators was low, even when ingredient information was available.”
The feeding trials in detail
Reading the trial numbers. BMI, or body mass index, is weight in kilograms divided by height in meters squared; it does not directly measure body fat. In the NIH trial below, ± gives the standard error, which describes uncertainty around the estimated average, not the range of individual results. A P value describes how compatible the data are with no difference under the statistical model; it does not give the probability that a finding is true. A 95% confidence interval (CI) gives a range expressing statistical uncertainty around an estimate.
NIH inpatient trial (Hall et al., Cell Metabolism, 2019). In the NIH trial, 20 weight-stable adults (10 men, 10 women; mean age 31.2; mean BMI 27) were randomized to two weeks of an ultra-processed or unprocessed diet, immediately followed by two weeks of the other. Meals were matched for presented calories, energy density, macronutrients, sugar, sodium and fiber. Energy intake was 508 ± 106 kcal/day higher on the ultra-processed diet (p = 0.0001), from carbohydrate (280 kcal/day) and fat (230 kcal/day) but not protein. Participants gained 0.9 ± 0.3 kg on the ultra-processed diet and lost 0.9 ± 0.3 kg on the unprocessed diet. Weight changes were highly correlated with energy intake (r = 0.8). Here r measures how closely the two varied together, from −1 to 1: 0.8 indicates a strong tendency for greater intake to accompany greater weight gain, not an 80% increase in weight. The NIH’s announcement said small protein differences between the diets might account for as much as half of the calorie-intake gap. Hall announced his early retirement from the NIH in April 2025, after 21 years there, citing concerns about the reporting of his research; HHS disputed his account.
UK UPDATE trial (Dicken et al., Nature Medicine, 2025). In this crossover trial, 55 adults in England (BMI 25 to under 40; habitually getting at least half their calories from ultra-processed food) received two eight-week, eat-as-much-as-you-like diets following the UK Eatwell Guide, one minimally processed and one ultra-processed, in random order; 50 made up the intention-to-treat sample, analyzed according to their assigned diet sequence. Weight change was −2.06% on the minimally processed diet and −1.05% on the ultra-processed diet, a difference of −1.01 percentage points (95% CI −1.87 to −0.14; P = 0.024). About 91% of participants were women, and mean age was 43. Mild gastrointestinal side effects were common on both diets. Kevin Hall, listed as an independent researcher, was a co-author.
The mortality studies in detail
A hazard ratio (HR) compares rates during follow-up; a risk ratio compares risks. Values above 1 indicate higher rates or risk in the comparison described. A 95% confidence interval (CI) shows statistical uncertainty. I² describes variation between study results. In observational research, adjusting for measured differences cannot remove every other possible explanation for an association.
Dose-response meta-analysis (Liang et al., Systematic Reviews, 2025). The meta-analysis pooled 18 prospective cohort studies with 1,148,387 participants and 173,107 deaths. Highest versus lowest intake: HR 1.15 (95% CI 1.09–1.22; I² = 83%). For each 10-percentage-point increase in the ultra-processed share of intake, HR was 1.10 (1.04–1.16; I² = 91%). The authors combined studies measuring shares of total dietary energy or total food weight, assuming those shares were equivalent and converting other intake measures to that basis. This is not a relative 10% increase in an existing amount or one fixed food portion. The dose-response analysis used 10 studies, with 458,481 participants and 67,995 deaths. The association was linear, and sex distribution partly explained the heterogeneity, with higher risk in men.
EPIC (González-Gil et al., The Lancet Regional Health–Europe, 2025). In the EPIC analysis, 428,728 participants (71.7% women) were followed for a mean of 15.9 years, with 40,016 deaths. For each one-standard-deviation higher ultra-processed intake—a study-specific step based on how widely participants’ intakes varied, not a fixed serving—hazard ratios were 1.04 for all-cause mortality, 1.09 for circulatory disease, 1.11 for cerebrovascular disease, 1.10 for ischemic heart disease, 1.12 for digestive disease and 1.23 for Parkinson’s disease. There were no associations with cancer or Alzheimer’s mortality. Replacing processed and ultra-processed foods with unprocessed or minimally processed foods was associated with lower mortality risk.
Nurses’ Health Study and Health Professionals Follow-up Study (Fang et al., BMJ, 2024). The Harvard analysis followed 74,563 women and 39,501 men without cancer, cardiovascular disease or diabetes at baseline for a median of 34 and 31 years; 30,188 women and 18,005 men died. Highest versus lowest quarter: HR 1.04 (1.01–1.07) for all-cause mortality and 1.09 (1.05–1.13) for deaths from causes other than cancer or cardiovascular disease. Death rates were 1,472 and 1,536 per 100,000 person-years in the lowest and highest quarters. Person-years add together participants’ observation time: 100,000 person-years could represent 10,000 people followed for 10 years, rather than 100,000 people. Whole grains were removed from the ultra-processed category in the primary analysis. No consistent associations appeared within each quarter of diet quality (Alternative Healthy Eating Index-2010), while better diet quality was linked to lower mortality within each quarter of ultra-processed intake.
BMJ umbrella review (Lane et al., 2024). The review, led by Melissa Lane with senior author Wolfgang Marx at Deakin University’s Food & Mood Centre, assessed 45 unique pooled analyses covering 9,888,373 participants. Greater exposure was directly associated with 32 (71%) of the health parameters studied. The all-cause mortality association was “highly suggestive” (class II; risk ratio 1.21) with low GRADE certainty. The cardiovascular-mortality association met the review’s “convincing” class (class I; risk ratio 1.50) with very low GRADE certainty. Those two systems ask different questions, which is why a result can look statistically consistent and still be causally uncertain.
German Diabetes Center umbrella review (Barbaresko et al., Critical Reviews in Food Science and Nutrition, 2025). The review, with senior author Sabrina Schlesinger, included 16 publications (systematic reviews with meta-analyses) and found moderate-certainty evidence for all-cause mortality (summary risk ratio 1.02 per 50 g/day), cardiovascular disease incidence and mortality, type 2 diabetes and colorectal cancer. It was first published online in 2024.
The subgroup findings in detail
Mortality by subgroup (Fang et al., 2024). Meat/poultry/seafood-based ready-to-eat products had hazard ratios from 1.06 to 1.43 across mortality outcomes. Sugar-sweetened and artificially sweetened beverages (HR 1.09), dairy-based desserts (1.07) and ultra-processed breakfast foods excluding whole grains (1.04) were also associated with higher all-cause mortality. The association was generally stronger for sugar-sweetened than for artificially sweetened drinks.
Type 2 diabetes by subgroup (Chen et al., Diabetes Care, 2023). In the Harvard diabetes analysis of 198,636 participants across three cohorts (19,503 cases), the highest versus lowest fifth of total ultra-processed intake had HR 1.46 for type 2 diabetes. Refined breads; sauces, spreads and condiments; sweetened beverages; animal-based products; and ready-to-eat mixed dishes were linked to higher risk. Cereals; dark and whole-grain breads; packaged sweet and savory snacks; fruit-based products; and yogurt and dairy-based desserts were linked to lower risk. The accompanying meta-analysis found 12% higher relative risk per 10-percentage-point increase in ultra-processed food as a share of total diet weight, measured in grams. For example, a change from 20% to 30% of total food weight is 10 percentage points; it is not a relative 10% increase in an existing amount. This weight-based measure differs from a share of calories.
Sources
- Monteiro CA, et al. NOVA food classification, Public Health Nutrition, 2018: PubMed 28322183
- Hall KD, et al. NIH inpatient trial, Cell Metabolism, 2019: PMC7946062
- CNN, April 16, 2025: Top NIH nutrition researcher studying ultraprocessed foods departs
- National Institutes of Health news release, May 16, 2019: NIH study finds heavily processed foods cause overeating and weight gain
- Dicken SJ, et al. UPDATE trial, Nature Medicine, 2025: PubMed 40760353
- Liang S, et al. Dose-response meta-analysis, Systematic Reviews, 2025: PubMed 40033461
- González-Gil EM, et al. EPIC, The Lancet Regional Health–Europe, 2025: PubMed 39867840
- Fang Z, et al. Nurses’ Health Study and Health Professionals Follow-up Study, BMJ, 2024: PubMed 38719536
- Lane MM, et al. Umbrella review, BMJ, 2024: bmj-2023-077310
- Barbaresko J, et al. Umbrella review, Critical Reviews in Food Science and Nutrition, 2025: PubMed 38363072
- Chen Z, et al. Type 2 diabetes cohorts, Diabetes Care, 2023: PubMed 36854188
- Braesco V, et al. NOVA classification agreement, European Journal of Clinical Nutrition, 2022: PubMed 35314769
- World Health Organization: Call for experts to develop a WHO guideline on consumption of ultra-processed foods (May 15, 2025) and Guideline Development Group for ultra-processed foods
- US Departments of Agriculture and Health and Human Services: Dietary Guidelines for Americans, 2025–2030
Notes
- Note 1: The NOVA paper was funded by Brazil’s Conselho Nacional de Desenvolvimento Científico e Tecnológico (CNPq) and the São Paulo Research Foundation (FAPESP).
- Note 2: The classification study received minimal funding (less than 5% of its cost) from the French Fund for Food and Health, which the authors describe as partially sponsored by the food industry. Several authors also report food-industry grants outside the study.
- Note 3: The NIH trial was supported primarily by the NIDDK Division of Intramural Research. One co-author reported speaking reimbursements from companies selling nutritional products, a seat on the scientific advisory council of Kerry Taste and Nutrition, and membership in an academic consortium funded by Abbott Nutrition, Nestec and Danone.
- Note 4: The UPDATE trial was funded by the NIHR UCLH Biomedical Research Centre and the Rosetrees Trust; the authors state it had no industry funding. Senior author Rachel Batterham has been an employee and shareholder of Eli Lilly since May 2023, and another co-author receives royalties for a book on ultra-processed food.
- Note 5: Funded by the Beijing Nova Program, a Beijing science-funding scheme whose name is unrelated to the NOVA food classification. The authors declared no competing interests.
- Note 6: Funded by the Institut National du Cancer and World Cancer Research Fund International.
- Note 7: Funded by US National Institutes of Health grants. One co-author received a consulting fee from the Pan American Health Organization on nutrition labeling.
- Note 8: The BMJ umbrella review had no specific funding. Most authors are affiliated with Deakin University’s Food & Mood Centre, which has received research funding from Be Fit Food, Bega Dairy and Drinks and the a2 Milk Company.
- Note 9: Funding and competing-interest statements for the German Diabetes Center review aren’t listed in its PubMed record. Two authors are affiliated with the German Nutrition Society.
- Note 10: The diabetes analysis was funded by US National Institutes of Health grants. Its senior author reported speaker and consulting fees from the Dairy Farmers of Canada, outside the submitted work.
Photo credits
Images from Pexels.
- featured: Photo by Julia M Cameron — original Pexels photo.
- inline-1: Photo by Leeloo The First — original Pexels photo.
- inline-2: Photo by Selma Nigar Baştürk — original Pexels photo.
Leave a Reply