
Health
Which Blood Tests Change as We Age?
Kidney function, TSH, HbA1c and hemoglobin all shift with age. Some shifts are normal aging; others signal disease. Most lab ranges don't adjust for age.
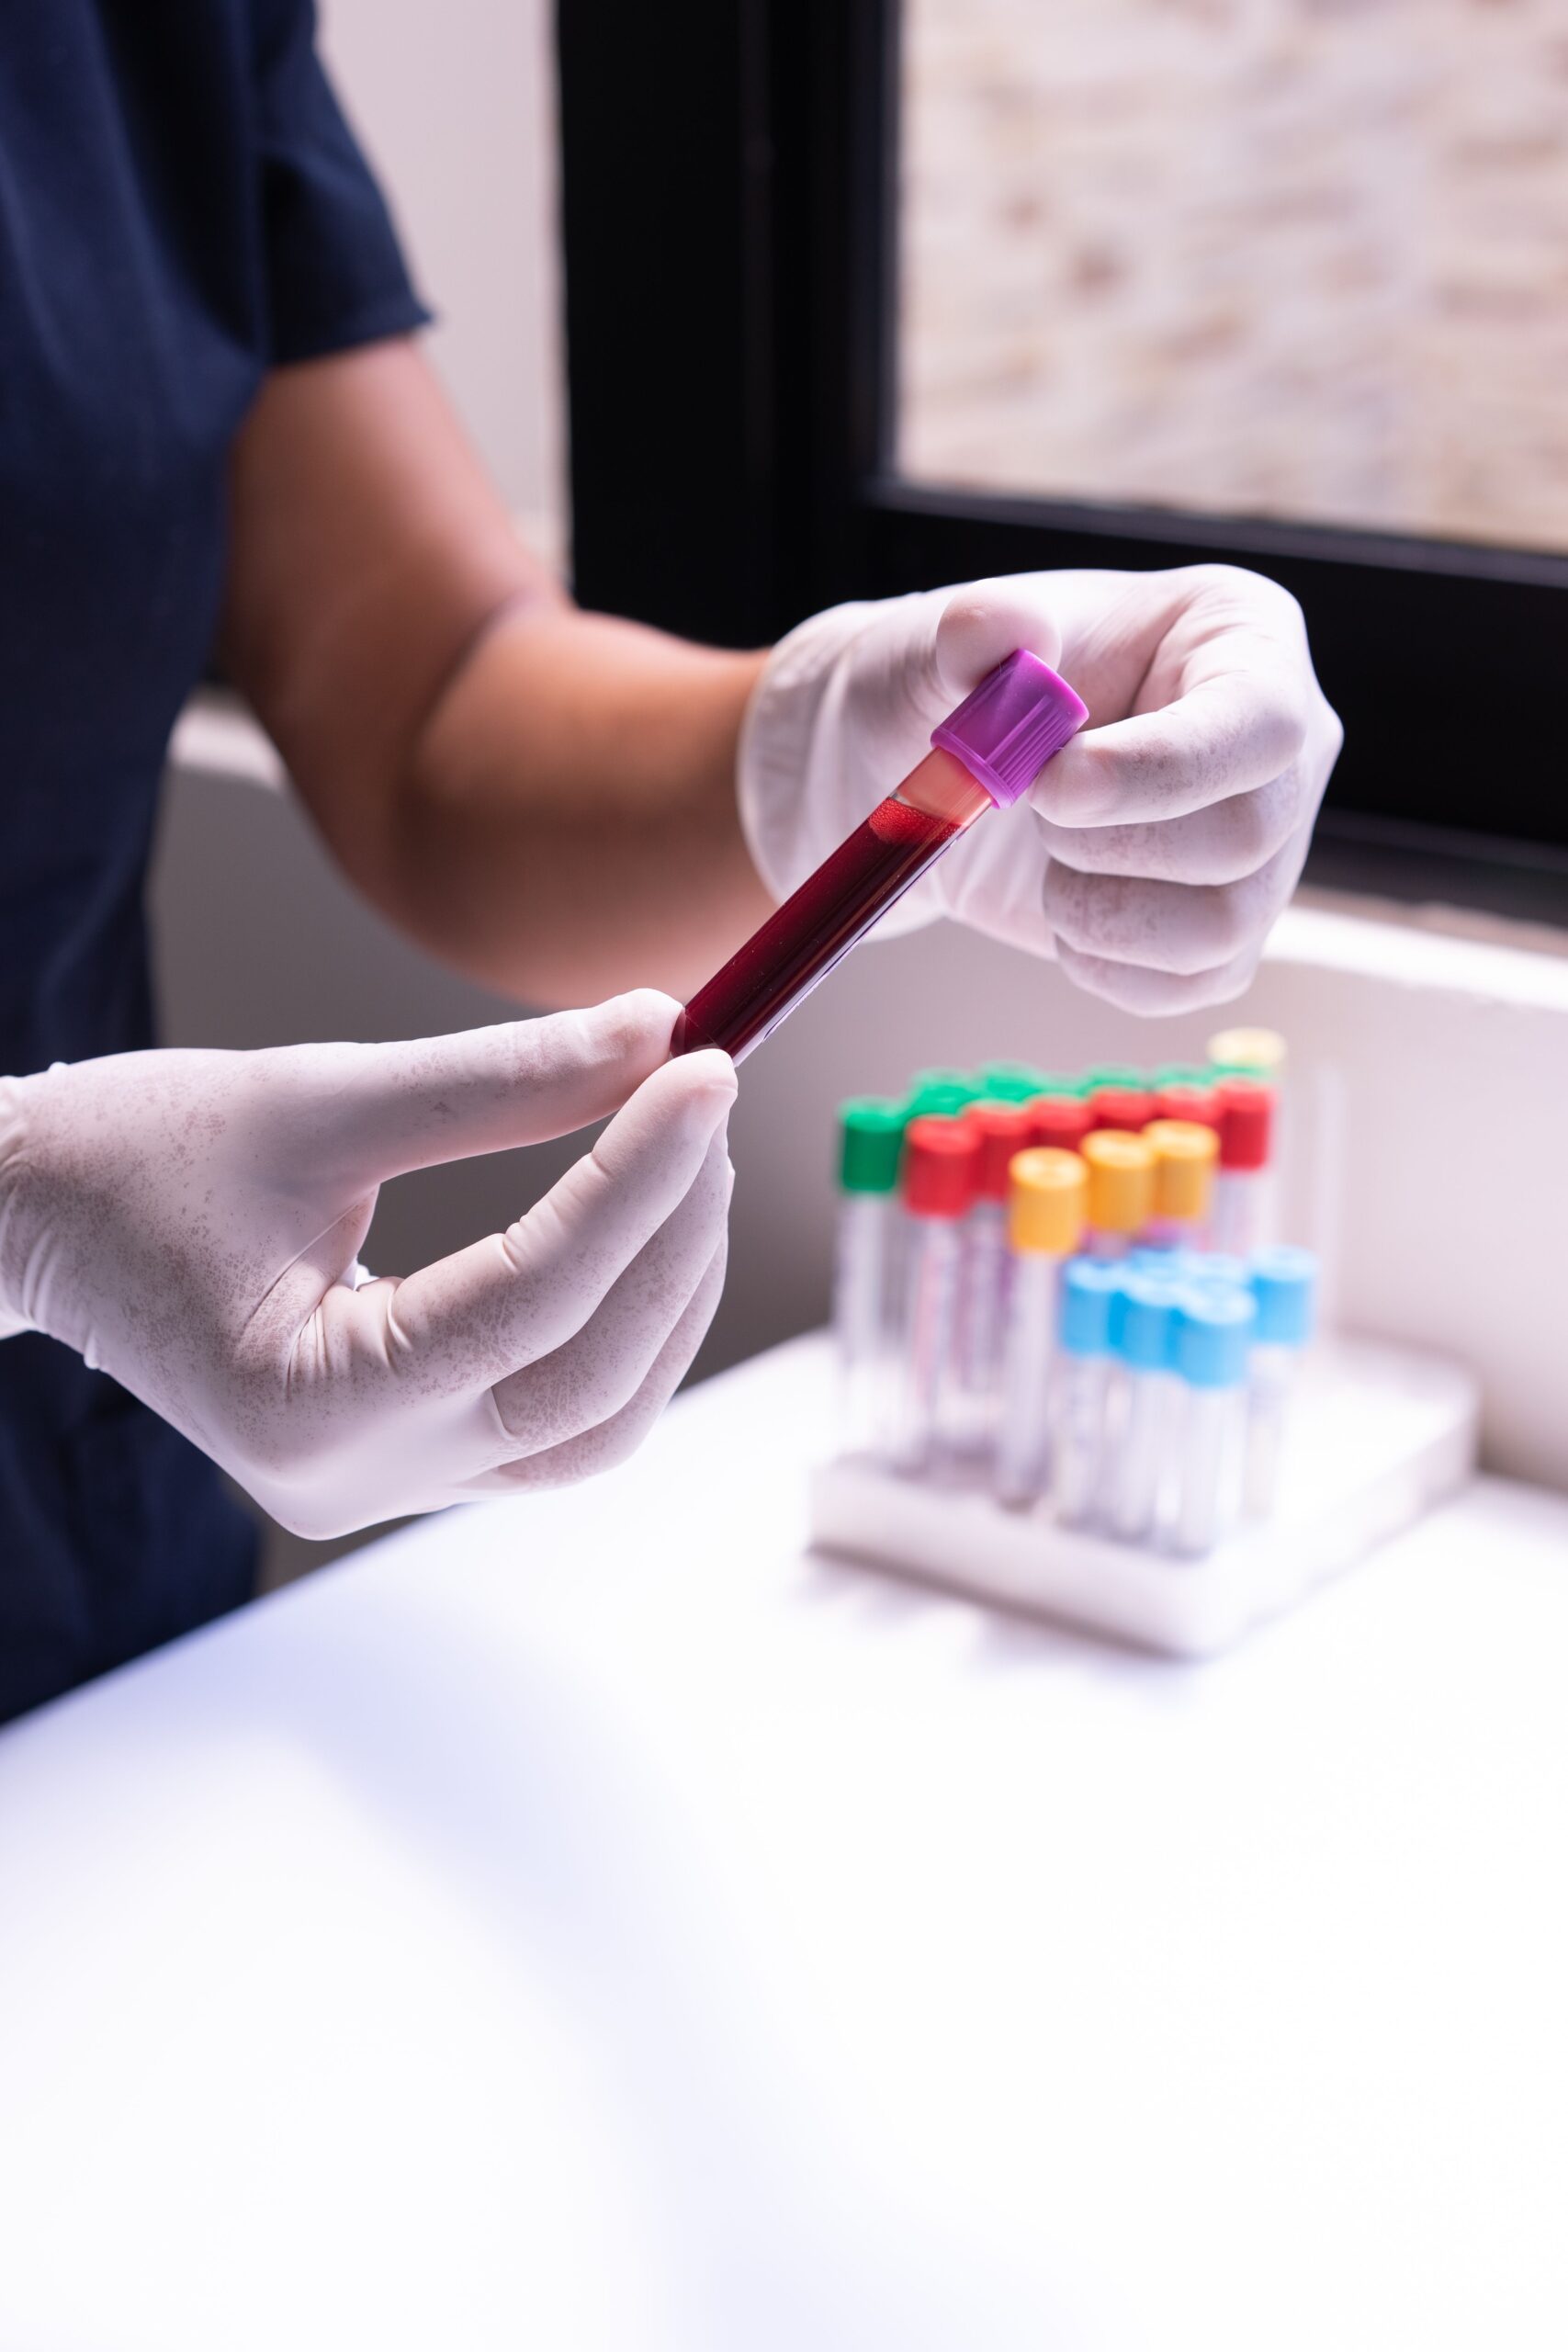
A result that was always normal starts drifting toward the edge of the range. Your kidney estimate slips, your thyroid number rises, your blood sugar marker creeps up. If you’ve wondered which blood tests change as we age, and whether a change means disease or just birthdays, the answer depends on the test. Some reference intervals vary by age; many clinical decision thresholds do not. Humanic Blue looks at both the population data and current guidance to sort out that distinction.
Several common markers shift with age in population studies. Measured kidney filtration tends to decline. Thyroid-stimulating hormone (TSH) readings tend to be higher, and HbA1c, a measure of average blood sugar, rises modestly even among people without diagnosed diabetes. Anemia becomes more common after 50, and older U.S. survey data left about one-third of cases unexplained. None of those patterns makes an abnormal result harmless. Current kidney and diabetes definitions retain fixed decision thresholds, while thyroid interpretation depends on symptoms, repeat testing, free thyroxine, a thyroid hormone measured in blood, and clinical context. For living longer and better, the useful question is what the change means for this person—not whether birthdays get automatic veto power.
The four markers below show why a change that is common with age still needs explanation.
Key Takeaways
- Studies find age-related differences in kidney filtration, TSH and HbA1c even in people without the relevant diagnosed disease.
- Age can shift population distributions, especially for TSH, but an age-associated result still requires clinical interpretation.
- Age-related changes can also hide real disease; the older US survey discussed below identified causes in about two-thirds of anemia cases among older adults.
1. Does kidney function (eGFR) change with age?
eGFR, the estimated glomerular filtration rate, is calculated from filtration markers—usually blood creatinine—and estimates how well the kidneys filter. Under the 2024 Kidney Disease: Improving Global Outcomes (KDIGO) guideline, an eGFR below 60 mL/min/1.73 m² (milliliters filtered per minute, adjusted to a standard body surface area) is a criterion for chronic kidney disease only when the abnormality is present for more than three months; a single low result does not show that the change has persisted.
Measured filtration tends to fall with age even without other recognized kidney damage. In a 2019 review in the Journal of the American Society of Nephrology, an international group led by Pierre Delanaye argued that a fixed threshold can blur kidney aging and kidney disease and proposed an age-adapted definition.
That proposal is not current practice. KDIGO 2024 explicitly retained 60 for older adults because adverse-outcome risk rises below that level. It recommends checking how long the abnormality has lasted and whether albumin, a protein, is leaking into urine. When cystatin C, another blood marker of filtration, is available, it recommends using both creatinine and cystatin C for a more accurate estimate. Age belongs in the risk discussion; it does not erase the current diagnostic framework.
2. Thyroid (TSH)
TSH, thyroid-stimulating hormone, is the standard screening test for thyroid function. Higher TSH usually means an underactive thyroid.
A 2007 analysis of US national survey data by Martin Surks and Joseph Hollowell found that the range of TSH readings moves steadily higher with age. They argued that a single reference range for all ages could label too many older people as having subclinical hypothyroidism: raised TSH with a normal thyroid-hormone level. The analysis compared age groups at one point in time; it did not show that any particular TSH is safe or should go untreated. The age-specific figures are in the evidence details below.
In practice, TSH is interpreted with symptoms, free thyroxine, medications, prior results and repeat testing when appropriate. The US Preventive Services Task Force (USPSTF) finds insufficient evidence to determine the balance of benefits and harms of screening nonpregnant adults without symptoms; that is not a recommendation to ignore symptoms or an abnormal result.
3. Does blood sugar (HbA1c) rise with age?
HbA1c reflects glucose exposure over roughly two to three months. The American Diabetes Association’s (ADA) 2026 Standards of Care retain 6.5% as the diabetes threshold. Unless blood sugar is unmistakably high in the appropriate clinical setting, diagnosis requires confirmation.
In a 2008 Diabetes Care study of people without diabetes in two US population studies, HbA1c was modestly higher in older groups. The pattern remained after excluding people whose blood sugar rose abnormally during a glucose-tolerance test. The study describes differences between age groups, not how much one person’s HbA1c will rise each year.
The authors called for research on age-specific criteria. Current diabetes thresholds have not changed by age. The ADA also cautions that anemia, changes in how quickly red blood cells are replaced, kidney failure, dialysis, cirrhosis (advanced liver scarring) and other conditions can disrupt the relationship between HbA1c and glucose; in those settings, diagnosis may need to rely on blood-glucose tests instead.
4. Hemoglobin and anemia
Hemoglobin carries oxygen in red blood cells. Low hemoglobin is anemia.
In NHANES III data collected from 1988 to 1994, Jack Guralnik and colleagues found that anemia became more common after age 50 and exceeded 20% among people 85 and older. These figures came from a survey conducted decades ago, not a current forecast for every older adult.
That analysis did not establish aging itself as the cause of anemia. In it, roughly one-third of cases involved nutrient deficiency, one-third involved chronic inflammation or kidney disease, and one-third remained unexplained within the available survey data. Vitamin B12 is one possible contributor; the National Institute on Aging advises that some older adults may need fortified foods or a supplement after discussing their needs with a clinician.
How would you distinguish a finding that becomes more common with age from one explained by age alone?
Should lab ranges change with age?
This is where a seemingly simple question (should the range move with age?) turns into a genuine tug-of-war among researchers.
| Marker | How it drifts with age | Risk of using young-adult ranges | Risk of age-adjusting |
|---|---|---|---|
| eGFR | Tends to fall | May increase diagnoses in older adults | Conflicts with current KDIGO guidance and could miss risk |
| TSH | Tends to rise | Could label age-associated readings as thyroid dysfunction | Could miss real thyroid disease |
| HbA1c | Rises slightly | Could flag more older adults | Thresholds unchanged; outcome data lacking |
| Hemoglobin | Falls (anemia more common) | Flags anemia that often has a cause | Could normalize treatable deficiencies |
The table shows why the debate is hard. Age-adjusted ranges might reduce some biochemical labeling, but current decision thresholds are also tied to risk. And anemia shows why “common with age” cannot be translated into “harmless.”
What might an age-adjusted range clarify, and what might it conceal?
What’s Interesting
The same number can sit at a different percentile at different ages. A TSH of 5 mIU/L may be unusual in a younger adult and statistically common in the oldest age groups. But percentiles are not diagnoses, and KDIGO still treats persistent eGFR below 60 as chronic kidney disease at older ages. Reading a lab report well means reading the age, history and companion tests next to the number. The number does not get to arrive alone and declare itself mayor.
The patterns above come from studies of groups of people. Any one person’s kidney, thyroid or blood-sugar numbers may move faster, slower or hardly at all, depending on genes, medications and conditions a population chart can’t see.
What This Means in Practice
The guidance and studies above point to different interpretation questions:
- Kidney results: KDIGO considers persistence, urine albumin and, when available, the combined creatinine–cystatin C estimate.
- Thyroid results: Symptoms, thyroid-hormone levels and previous results help distinguish a statistical age pattern from thyroid dysfunction.
- Anemia: The survey identified nutrient deficiency, inflammation and kidney disease among causes; age alone did not explain the finding.
- Confirmation: KDIGO and ADA definitions distinguish a single abnormal result from a confirmed diagnosis. A clinician can explain which follow-up applies.
A primary care clinician can interpret these results in context. An endocrinologist handles thyroid questions, a nephrologist kidney results and a hematologist unexplained anemia. How to prepare for tests and track results is covered in Longevity Blood Test Checklist.
Bottom Line
Several blood tests change as we age. Kidney filtration tends to fall, TSH and HbA1c distributions rise, and anemia becomes more common. Those are population patterns, not permission to relabel disease as normal aging. Current kidney and diabetes definitions retain fixed thresholds, while thyroid and anemia results require context and appropriate follow-up. For living longer and better, the distinction is between noticing a population pattern and understanding a person’s result alongside symptoms, prior values and companion tests.
A NOTE FROM LONGEVITY365
We read research, consult expert perspectives and work to make complicated health information easier to understand. What you’re reading here reflects how we’ve interpreted and organized that information. It is educational content—not personal medical advice, diagnosis or treatment guidance.
We’re not perfect, and neither is the available research. Evidence changes, new studies emerge and what’s appropriate for one person may not be appropriate for another.
Use this article as a starting point for your own research and conversations with qualified professionals. Always talk with your doctor or another trusted healthcare professional before making decisions that could affect your health, particularly if you take medications, are receiving treatment, have existing health conditions, are pregnant or have other circumstances that could affect what’s appropriate for you.
Reader Questions
A few questions to carry into the comments or your next conversation. Please leave out identifying or personal medical details.
- 01After reading this, what would you want a test result to actually help you decide?
- 02Which distinction changed how you read the evidence: "1. Does kidney function (eGFR) change with age" or "Should lab ranges change with age"?
- 03What would you ask a clinician, lab, or qualified professional before letting a number change a health decision?
Extra Insights & Sources
The evidence summaries and linked sources behind this article.
What We Know
- eGFR, TSH and HbA1c shift with age in healthy people. Supported.
- One NHANES III analysis estimated that 70% of older participants with TSH above 4.5 mIU/L still fell within their age-specific statistical range. Supported cross-sectionally; not a treatment threshold.
- Anemia becomes more common after 50, and two-thirds of cases in older adults have identifiable causes. Supported.
What We Don’t Know
- Whether age-adapted thresholds for kidney disease, thyroid function or diabetes would improve health outcomes. Unknown.
- What causes the one-third of anemia in older adults with no identified reason. Unknown.
Evidence Details
Age-specific figures from the studies:
TSH: Among people without thyroid disease, 10.6% of those in their 20s had TSH above 2.5, compared with 40% of those 80 and older. The 97.5th percentile—the value below which 97.5% of readings fell—was 3.56 for adults in their 20s and 7.49 for those 80 and older.
The authors calculated that 70% of older participants whose TSH exceeded 4.5 mIU/L still fell within their age group’s statistical reference interval. They argued that ignoring the age shift could overcount biochemical subclinical hypothyroidism. This was a cross-sectional reference-distribution analysis, not a trial showing that a particular TSH is safe or should go untreated.
HbA1c: HbA1c rose by 0.010 to 0.014 percentage points per year of age. The upper end of the normal distribution (97.5th percentile) was 5.6% to 6.0% in people under 40 but 6.2% to 6.6% in those 70 and older. The pattern held even after excluding people with impaired glucose tolerance.
Anemia: Overall, 11.0% of men and 10.2% of women age 65 or older met the study definition. These are older cross-sectional prevalence estimates, not a current forecast for every older adult.
NHANES stands for the National Health and Nutrition Examination Survey. TSH is reported in milli-international units per liter (mIU/L). HbA1c changes above are percentage points, not percentage changes in risk.
- Kidney function: the age-adapted-threshold argument comes from a 2019 expert review. KDIGO 2024 considered age explicitly and retained persistent eGFR below 60 as a diagnostic criterion, while emphasizing chronicity, albuminuria and more accurate combined creatinine–cystatin C estimation.
- TSH: NHANES III cross-sectional analysis of people without recognized thyroid disease. It describes how the population distribution shifts with age; it does not establish a safe treatment boundary or show benefit from age-specific diagnosis.
- HbA1c: cross-sectional analyses in Framingham Offspring and NHANES participants without diagnosed diabetes. The age association does not replace ADA diagnostic criteria, and HbA1c can be misleading when red-cell turnover or certain diseases alter the test.
- Anemia: NHANES III data from 1988–1994. Useful for showing prevalence and broad etiologic categories in older U.S. adults, but dated, cross-sectional and limited by what the survey measured.
Sources
- Kidney Disease: Improving Global Outcomes. KDIGO 2024 Clinical Practice Guideline for the Evaluation and Management of Chronic Kidney Disease. Current international guideline. Supports the requirement for abnormalities lasting more than three months, retention of the eGFR-below-60 criterion in older adults, albuminuria assessment and combined creatinine–cystatin C estimation when available.
- Delanaye P, Jager KJ, Bökenkamp A, et al. CKD: A call for an age-adapted definition. Journal of the American Society of Nephrology. 2019. Expert review arguing that healthy filtration decline can lead a fixed threshold to overdiagnose some older adults. This is a proposal, not the current KDIGO definition.
- Surks MI, Hollowell JG. Age-specific distribution of serum thyrotropin and antithyroid antibodies in the U.S. population. Journal of Clinical Endocrinology & Metabolism. 2007. Cross-sectional NHANES III analysis. Supports the age-related TSH distribution and 70% estimate; cannot determine treatment benefit or a safe individual threshold.
- U.S. Preventive Services Task Force. Thyroid dysfunction: screening. Current recommendation page. Finds insufficient evidence to assess screening in nonpregnant asymptomatic adults. It does not apply to people with symptoms, pregnancy or known thyroid disease.
- Pani LN, Korenda L, Meigs JB, et al. Effect of aging on A1C levels in individuals without diabetes. Diabetes Care. 2008. Cross-sectional Framingham Offspring and NHANES analysis. Supports the modest age-associated rise and age-stratified percentiles; does not show that diagnostic thresholds should change.
- American Diabetes Association Professional Practice Committee. Diagnosis and classification of diabetes: Standards of Care in Diabetes—2026. Current guideline. Supports the 6.5% HbA1c threshold, confirmatory testing without unequivocal hyperglycemia and the limitations of HbA1c when red-cell turnover or certain conditions alter its relationship with glucose.
- Guralnik JM, Eisenstaedt RS, Ferrucci L, Klein HG, Woodman RC. Prevalence of anemia in persons 65 years and older in the United States. Blood. 2004. Cross-sectional NHANES III analysis using 1988–1994 data. Supports prevalence and the approximate thirds of nutrient-deficiency, inflammation/kidney and unexplained cases; the estimates are not contemporary.
- National Institute on Aging. Healthy meal planning: tips for older adults. Current federal patient guidance. Supports discussing fortified vitamin B12 foods or supplementation where intake or absorption is a concern; it does not diagnose the cause of anemia.
Leave a Reply